|
|
Solar
Observations from SDL
One aspect of SOFIE calibration and testing will involve
measurements
of solar intensity from SDL in Logan, Utah. Figure 1 shows an example
of atmospheric transmissions
calculated for solar rays impinging the
earth's
surface, considering a variety of view angles and ground
elevations.
These results illustrate that the atmosphere is increasingly opaque as
view angle increases from zenith, and towards lower elevations. Table 1
lists atmospheric
transmissions calculated for each SOFIE band assuming an overhead sun
viewed from Logan. While a few channels are completely opaque
(small transmissions), many will receive a substantial signal when
viewing the sun from Logan. Figure
1. Atmospheric transmission
versus view angle calculated for the SOFIE 2.8 um CO2 channel weak band
(band 8). Curves are presented for various observation
altitudes (Logan is 1.38 km).
|
|
|||||||||||||||||||||||||||||||||||||||||||||||||||||||||
|
Solar
Simulator Tests
The brightest stimulus available for ground testing is a solar
simulator that achieves 3000K. This is low when compared to the sun
which behaves like a blackbody at 5780K. Figure 2 compares the
irradiance spectrum from a solar model to spectra from the Planck
function for
5780 and 3000K. Note that the Planck expression is a good approximation
to the overall shape and magnitude of the solar spectrum, but does not
contain the fine structure apparent in the model. The solar simulator
irradiance spectrum should be very close to that of the 3000K Planck
curve in Figure 2. |
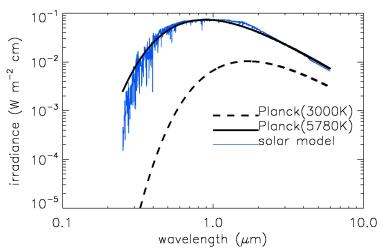 Figure
2. Irradiance spectrum from a solar model compared to
spectrum from the Planck function for 5780 and 3000K.
|
|||||||||||||||||||||||||||||||||||||||||||||||||||||||||
| Figure
3 (top) shows the irradiance values that result from integrating
the Planck function or the solar model, over
the spectral response functions for each SOFIE band. Irradiances
determined from the Planck function at 5780K closely match results
based on the solar model, except at the two shortest wavelengths where
the solar model gives roughly 50% less irradiance. The band integrated
irradiances for 3000K are less than the solar model values, ranging
from a factor of 0.45 at the longest wavelength to 0.0007 at the
shortest. The SOFIE pre-amp signal gains will be set such that the
unattenuated
sun viewed from orbit results in a signal of 3.6 volts entering each
balance attenuator. These settings will initially be predicted using
the SOFIE radiometric model. If the desired settings are achieved, then
the signals resulting from a 3000K stimulus should be as shown in
Figure 3 (bottom). |
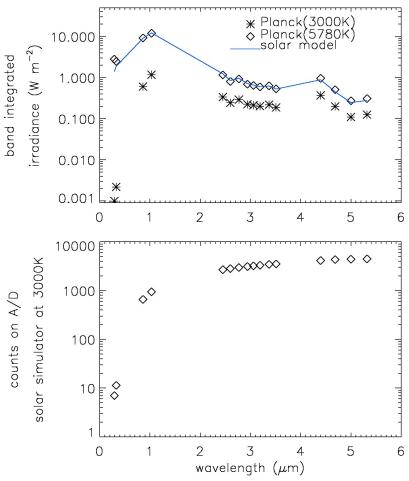 Figure
3. Top: Irradiance from a solar model and the Planck function
at two temperatures, integrated over the spectral response functions
for each SOFIE band. Bottom: The A/D counts resulting from a
3000K stimulus, assuming the on-orbit unattenuated solar signal into
the
balance attenuators is 3.6 volts.
|
|||||||||||||||||||||||||||||||||||||||||||||||||||||||||