|
Sun Sensor |
|
The
SOFIE instrument includes a sun sensor which provides precise knowledge
of the location of the solar image relative to the science
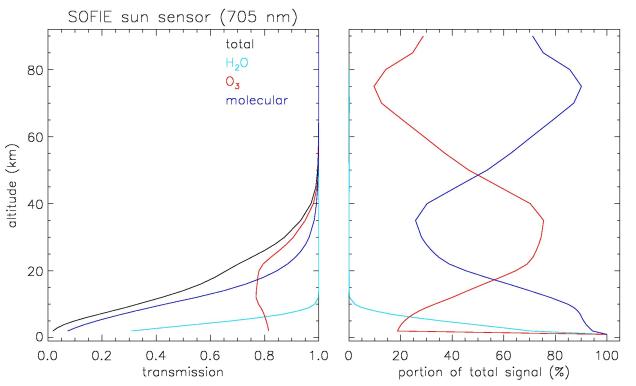
field-of-view. 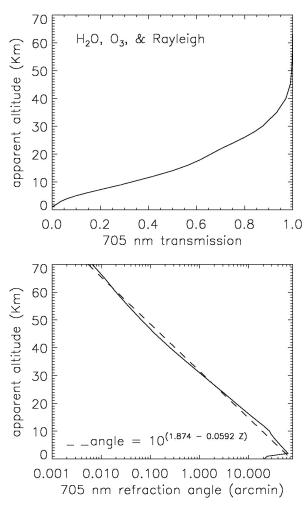 Figure 3. Top: Calculated limb path transmission for the sun sensor considering ozone and H2O absorption and Rayleigh (molecular) scattering for summer conditions at 60°N latitude. A breakdown of the attenuation by absorber is available here. Bottom: The refraction angle versus altitude calculated for the sun sensor wavelength and summer at 60°N latitude (solid line). A fit to these data (dashed line) allows refraction angles to be easily approximated as a function of altitude (km). |
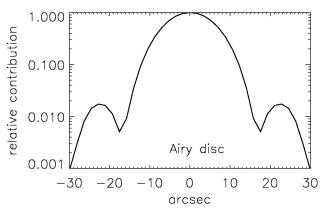
Figure 1. The sun sensor
Airy disc function, or
"blur circle". The Airy disc data are available below.
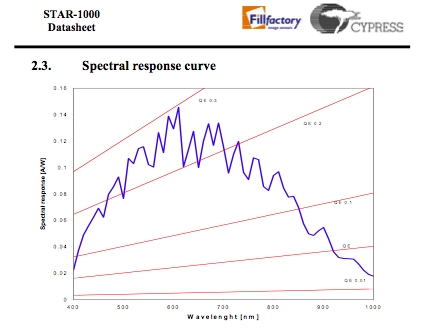
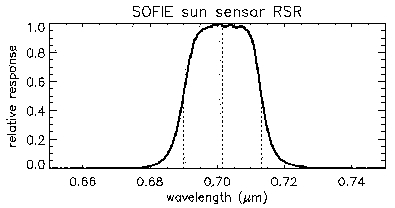 Figure 2. The SOFIE sun sensor RSR based on lab measurements of flight spare neutral density and bandpass filters, combined with the detector RSR reported by the manufacturer. The above curve does not include other intervening optics, however, they should not introduce spectral content. Vertical lines indicate band center and half power points. Sun sensor RSR data are available below. Resources Sun sensor relative spectral response data Star 1000 FPA
spectral response curve Spec sheet for the Star 1000 FPA The sun sensor Airy
disc function Theoretical basis for the sun sensor (word document). Conceptual movie of sunset from space, illustrating image refraction and attennuation (Quicktime). |