The Solar Source and SOFIE Measurements
Characteristics of the sun are an important consideration in solar
occultation measurements. Solar intensity is measured above the
Earth's atmosphere (exoatmospheric) and through the atmosphere
(endoatmospheric) during spacecraft sunset or sunrise. The ratio
of endoatmospheric to exoatmospheric intensity (Iendo/ Iexo) yields
transmission, which is the quantity used to determine atmospheric
properties. Since the same optical-electrical path is used to
measure Iendo and Iexo, solar occultation measurements are
essentially self calibrating. Complications arise,
however, due to spatial and spectral variability in solar
intensity.
The impact of solar source variability on SOFIE measurements was
examined using a description of solar intensity based on theory and
measurements
["Allen curves"]. The Allen relationship describes solar limb
darkening
(SLD) as a function of wavelength and distance from the sun's center.
The resulting SLD curves are radially symmetric and do not
account
for real solar features such as sun spots. These results
indicate
that movement of the FOV from its desired position on the sun
("lockdown" position") will induce false signals. Keeping these
movement-induced
signals below the measurement noise (or at least well below expected
signal
levels) places requirements on telescope pointing accuracy.
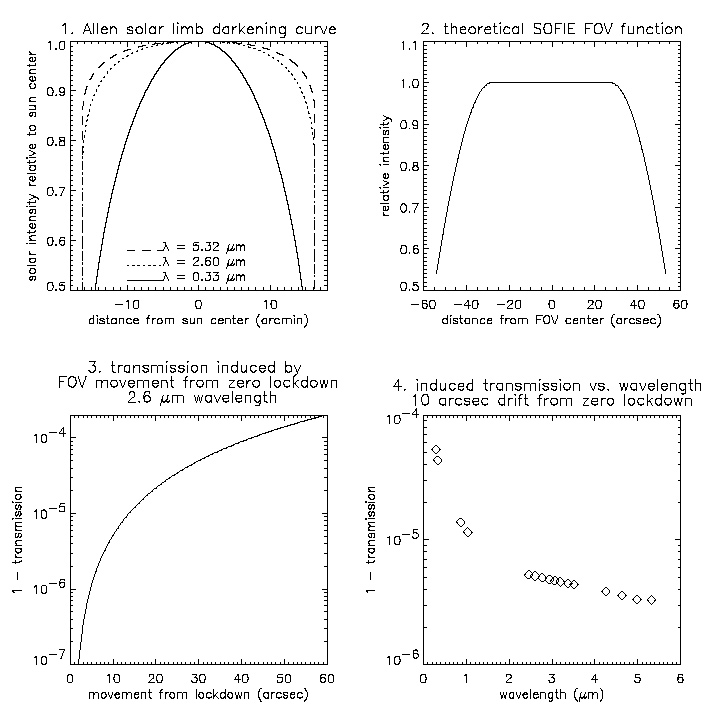
Solar intensity decreases from sun center to the solar edge, at
a rate that increases with decreasing wavelength (Figure 1).
Measured
solar intensities are affected by averaging over the instrument field
of
view (FOV). Solar intensities were averaged over a theoretical
SOFIE
FOV (Figure 2) for the calculations presented here. The SOFIE
FOV
center will be pointed at sun center ("zero lockdown") during a limb
scan.
Since solar intensity decreases away from sun center, FOV
drift
from lockdown will result in a decrease in the background solar
intensity.
This decrease will induce a false transmission signal, as
demonstrated
in Figure 3 for one SOFIE wavelength. Induced transmissions were
calculated
as the ratio of solar intensity at some distance from lockdown to the
value at lockdown. These results indicate that an unwanted FOV
drift
of roughly 5 arcsec will induce a false signal of 1e-6 at 2.6 microns
wavelength. Drift induced signals are larger at shorter
wavelengths, because the SLD curves are steeper at shorter
wavelengths (Figure 1). This
effect is demonstrated in Figure 4.
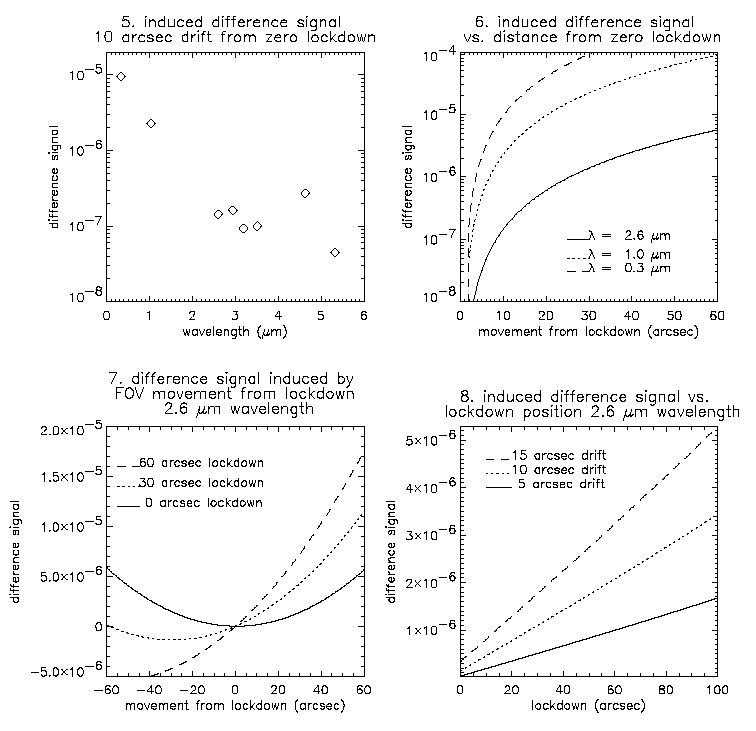
The effects of FOV movement from lockdown also impact the SOFIE band
pair difference (BPD) signal measurements. Because SLD is
wavelength dependent, the same amount of FOV drift will induce a
different signal in each SOFIE channel. Induced BPD signals were
calculated as the difference in induced transmission for each SOFIE
channel pair. Figure 5 shows the induced BPD signal versus
wavelength, for the FOV straying 10 arcsec from zero lockdown.
The effect on BPD measurements is driven by the spectral
dependence of solar intensity and the wavelength separation between
band pairs. Drift induced BPD signals are greatest where
the solar intensity is strongly dependent on wavelength (short
wavelengths)
and where band pairs are widely spaced. Figure 6 shows the
induced
band pair difference signal versus distance moved from zero lockdown
for three wavelengths. To keep the drift-induced BPD signal below
the measurement noise (about 1e-6) for the 1 micron particle channel,
the FOV cannot drift more than about 5 arcsec from lockdown.
The effect of FOV drift from lockdown depends on the lockdown position.
Figure 7 shows the induced 2.6 micron (H2O) difference signal vs.
distance moved from lockdown, for 3 lockdown positions.
When lockdown is off-center, drift towards sun center induces a
negative difference signal. If FOV drift were known to occur in
one direction (up or down), then the drift induced difference
signal could actually be minimized by using an off-center lockdown.
However, for random FOV drift (up or down relative to
lockdown), the effects of drift are minimized at zero lockdown.
Figure 8 shows the induced H2O channel difference signal vs.
lockdown position, for drifting 10 arcsec from lockdown.
These results further demonstrate the benefits of sun-center
lockdown. In addition, these results elude to the effects
of lockdown uncertainty. If lockdown is known to better than 25
arcsec, the induced difference signal is less than about 1e-6 if
FOV drift remains less than 10 arcsec.
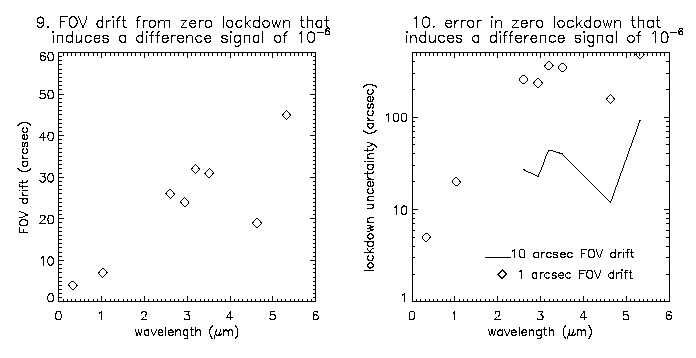
The effects of FOV drift are summarized by showing the amount of drift
(from zero lockdown) that will induce a difference signal equal to the
measurement noise (1e-6) (Figure 9). The ozone channel (0.3
microns) represents the worst case scenario for drift induced noise,
where roughly 3 arcsec FOV drift will induce a difference signal
of 1e-6 . The IR channels can tolerate about 25 arcsec FOV drift.
Another issue for pointing requirements is how well the lockdown
position must be known. For example, what is the result of
a 5 arcsec
lockdown when 0 arcsec is expected? If FOV drift does not occur,
then lockdown errors have no effect. However, if FOV
drift occurs, then induced signals occur at a rate determined by
the SLD curves.
If we know exoatmospheric FOV position exactly, then a
known
drift can be corrected using the SLD curve. If we do not know the
exoatmospheric FOV position, then a known drift cannot be
corrected. The question then, is how will uncertainty in
the exoatmospheric FOV position affect our ability to remove known
drift? Figure 10 shows how lockdown uncertainty can affect drift
induced difference signals. For example, if the FOV drifts
10 arcsec from zero lockdown, then the lockdown must be known to
within about 30 arcsec to keep the induced difference signal
below 1e-6 for the IR channels (the induced signal is always greater
than
1e-6 in the short wavelength channels for 10 arcsec FOV drift).
For
1 arcsec FOV drift, the lockdown uncertainty is relaxed to nearly
300
arcsec for the IR channels, but remains less than 20 arcsec for
the
short wavelength channels.
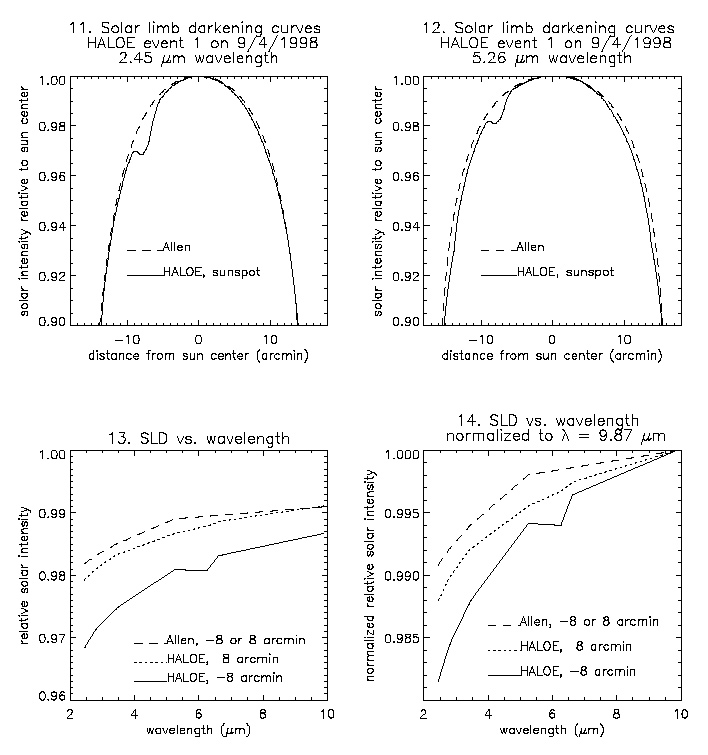
The above analysis used an idealized description of the sun ("Allen
curves"). Here we consider real solar variability by using HALOE
measurements of solar limb darkening. HALOE scans across the
solar disc outside the atmosphere before or after each occultation
event. These data offer
SLD measurements at 8 wavelengths covering the past 12 years. The
example
below shows HALOE SLD measurements that encountered a sunspot.
The measured
SLD curves at 2.45 and 5.26 microns wavelength are compared to Allen
curves
in Figures 11 and 12. A sunspot is evident near -8 arcmin,
as a sharp decrease in solar intensity. The SLD spectra
from HALOE and the Allen relationship are compared in Figures 13 and
14. HALOE SLD spectra at -8 arcmin are compared to the Allen
results for -8 arcmin. Because the sun is considered radially
symmetric, the HALOE SLD spectra at 8 arcmin is shown for
reference. While the HALOE SLD at 8 arcmin and the Allen SLD
spectra are close in magnitude (Figure 13), the relative
wavelength dependence of the HALOE measurements deviates from the Allen
predictions (Figure 14). The HALOE SLD measured under sunspot
conditions exhibits an even steeper slope than the quiescent HALOE
measurement or the Allen curve. Our next step is to determine the
effects of sunspots on SOFIE measurements using real SLD curves
measured by HALOE.