Design and Instrument Characteristics
SOFIE
Radiometric Characteristics
|
||||||
| Channel |
Band
/ Target |
Center
wavelength (microns) |
ND
filter transmission |
Spot
area on detector (mm2) |
Contamination
coefficient (25 mo. prediction) |
Total response (%) (calculated) |
| 1 |
1
/ O3 s |
0.291 |
0.3981 |
0.385 |
0.040 |
14.9 |
| 2
/ O3 w |
0.330 |
0.4074 |
0.196 |
0.050 |
14.9 |
|
| 2 |
3
/ PMC s |
0.867 |
0.3350 |
0.196 |
0.975 |
4.4 |
| 4
/ PMC w |
1.04 |
0.3251 |
0.126 |
0.976 |
16.8 |
|
| 3 |
5
/ H2O w |
2.46 |
0.3092 |
0.244 |
0.979 |
26.6 |
| 6
H2O s |
2.62 |
0.3085 |
0.205 |
0.980 |
25.8 |
|
| 4 |
7
CO2 s |
2.79 |
0.3081 |
0.259 |
0.977 |
29.3 |
| 8
/ CO2 w |
2.94 |
0.3080 |
0.398 |
0.969 |
31.4 |
|
| 5 |
9
/ PMC s |
3.06 |
0.3078 |
0.187 |
0.968 |
28.0 |
| 10
/ PMC w |
3.12 |
0.3078 |
0.344 |
0.974 |
30.4 |
|
| 6 |
11
/ CH4 s |
3.38 |
0.3080 |
0.325 |
0.943 |
40.4 |
| 12
/ CH4 w |
3.48 |
0.3079 |
0.556 |
0.950 |
45.1 |
|
| 7 |
13
/ CO2 s |
4.32 |
0.3053 |
0.534 |
0.980 |
48.0 |
| 14
/ CO2 w |
4.65 |
0.3045 |
0.499 |
0.980 |
51.6 |
|
| 8 |
15
/ NO w |
5.01 |
0.3035 |
0.344 |
0.980 |
51.2 |
| 16
/ NO s |
5.32 |
0.3032 |
0.261 |
0.980 |
40.1 |
|
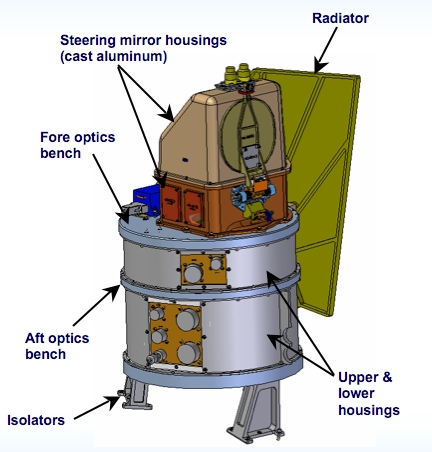
Figure 1. The SOFIE instrument from design drawings at CDR.
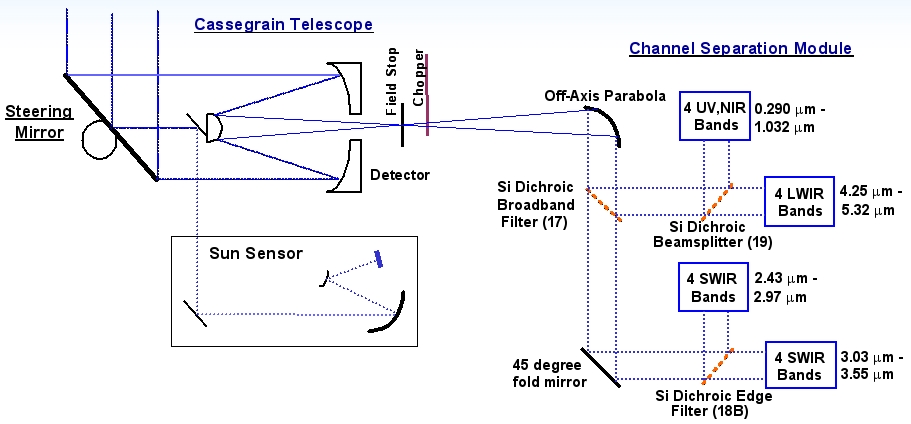
Figure 2. The overall SOFIE optical layout, showing the main telescoope, channel separation module, and sun sensor.
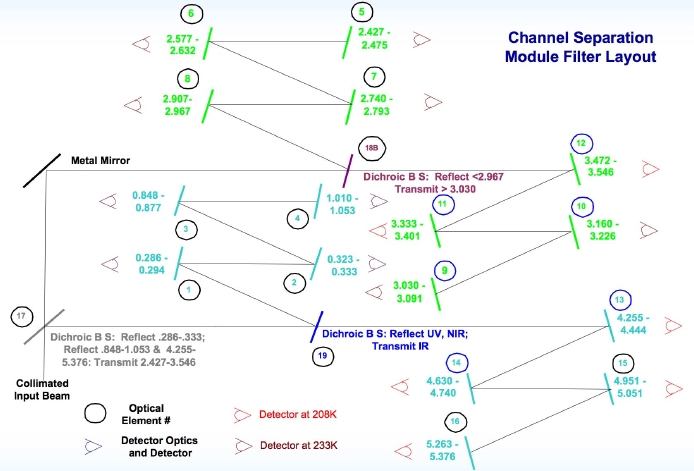
Figure
3. The SOFIE channel separation module (CSM), illustrating
how energy is divided into the 16 bands.
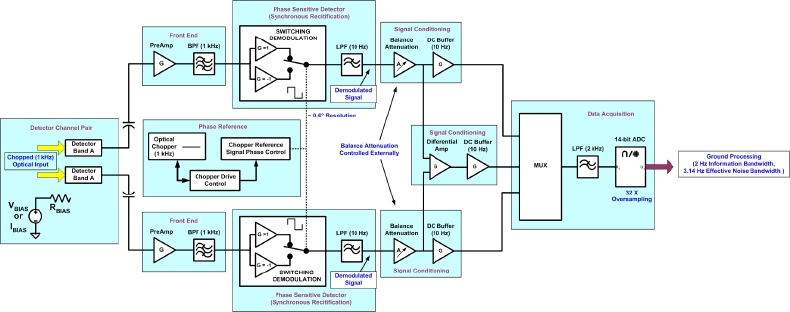
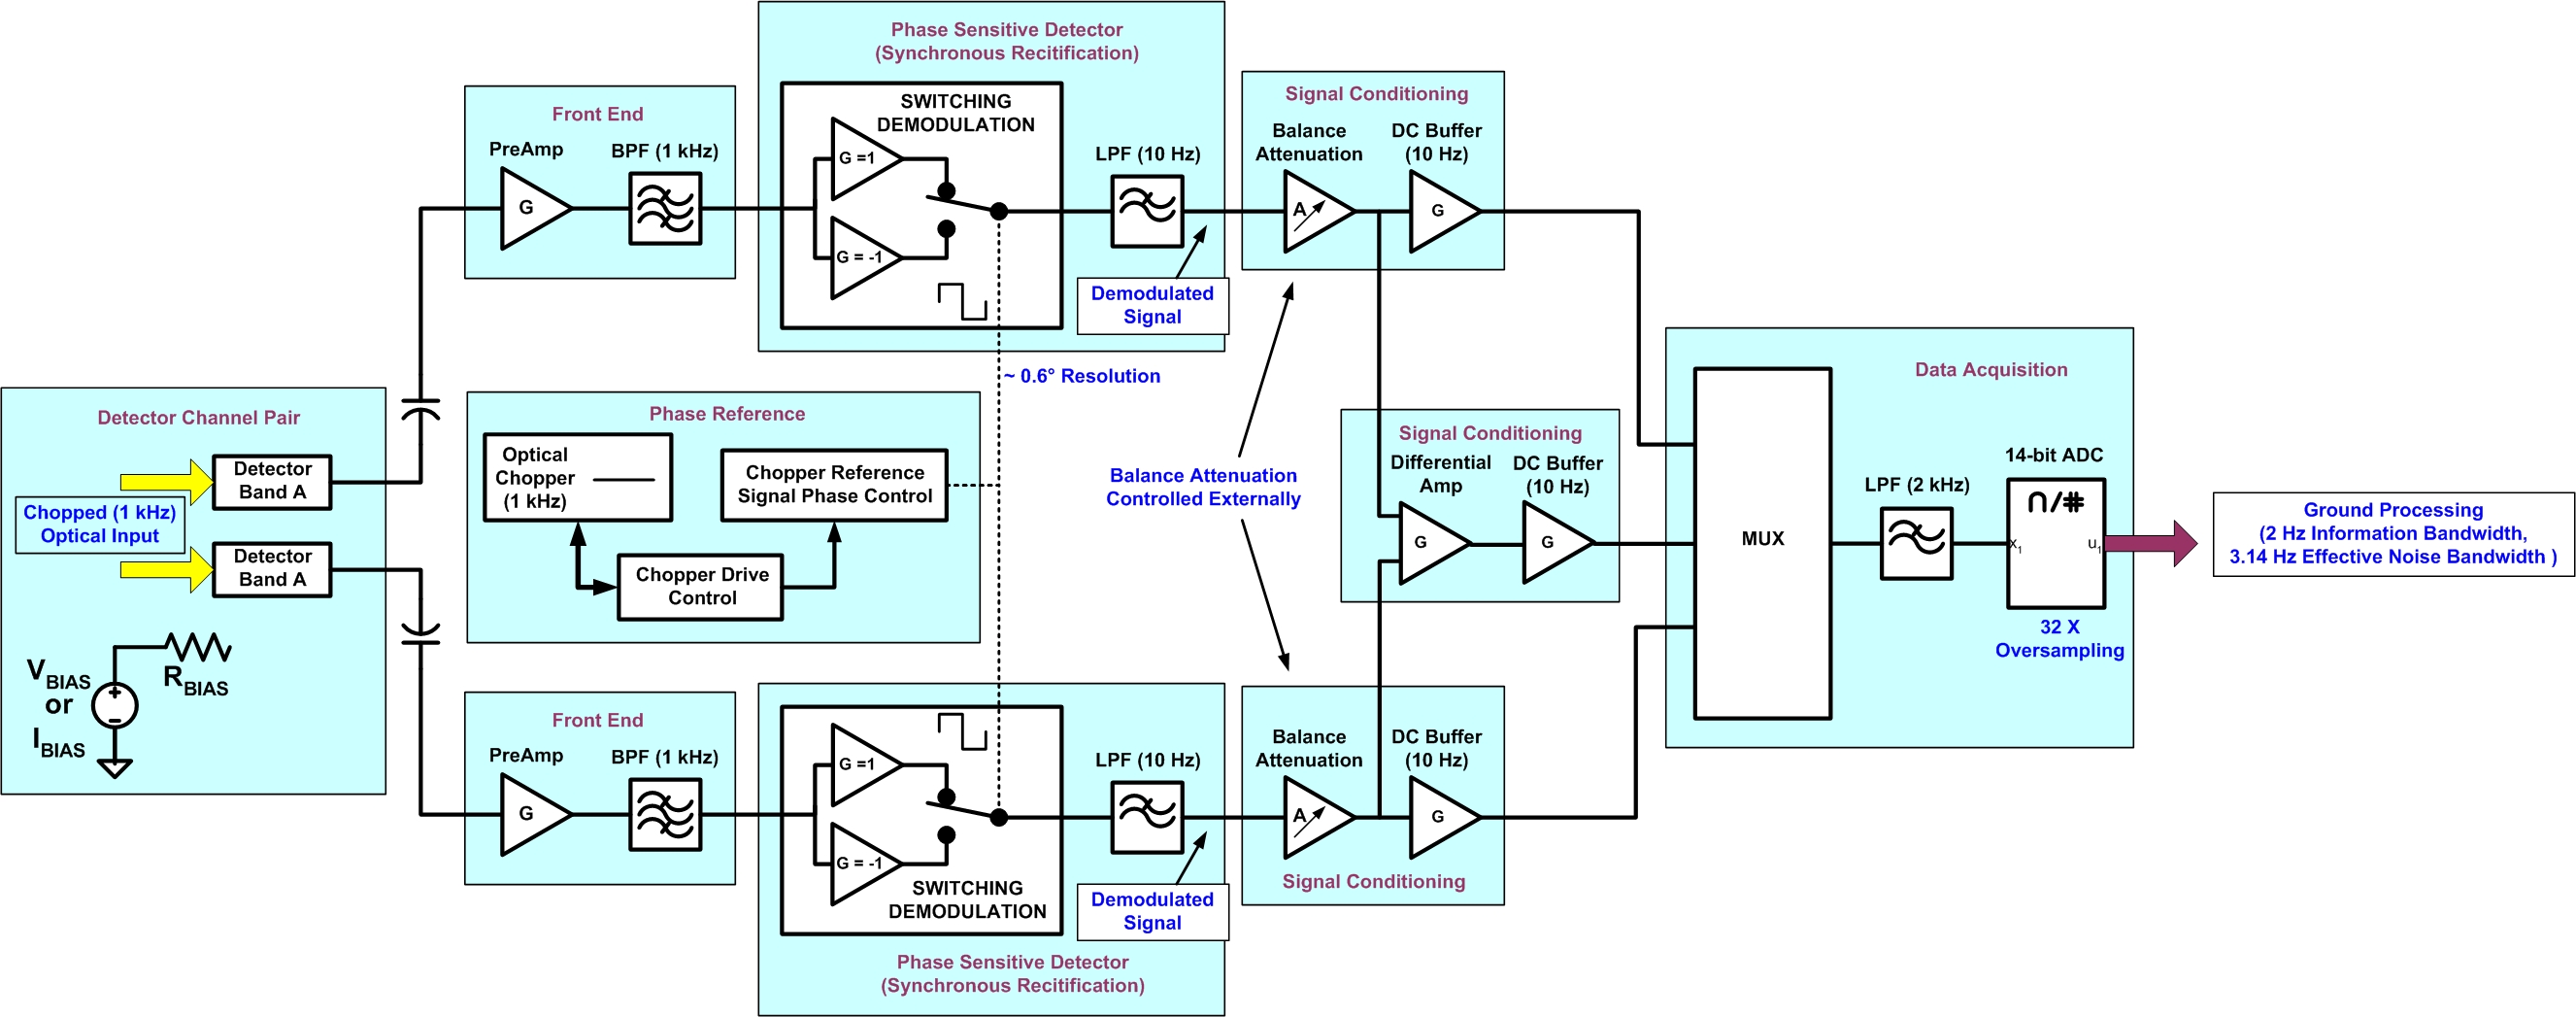
Figure 4. Science signal processing electronics (large image).