
|
Spectral ResponseThe
relative spectral response (RSR) of a given band is a function of
the intervening optical elements and the detector. Figure 1
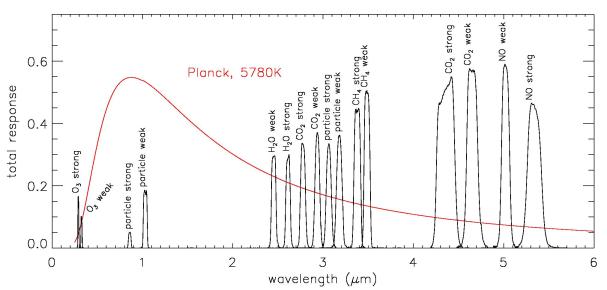
shows the total response for each
SOFIE band calculated using measured characteristics of flight
components. Examples of
measured detector response for various SOFIE bands are
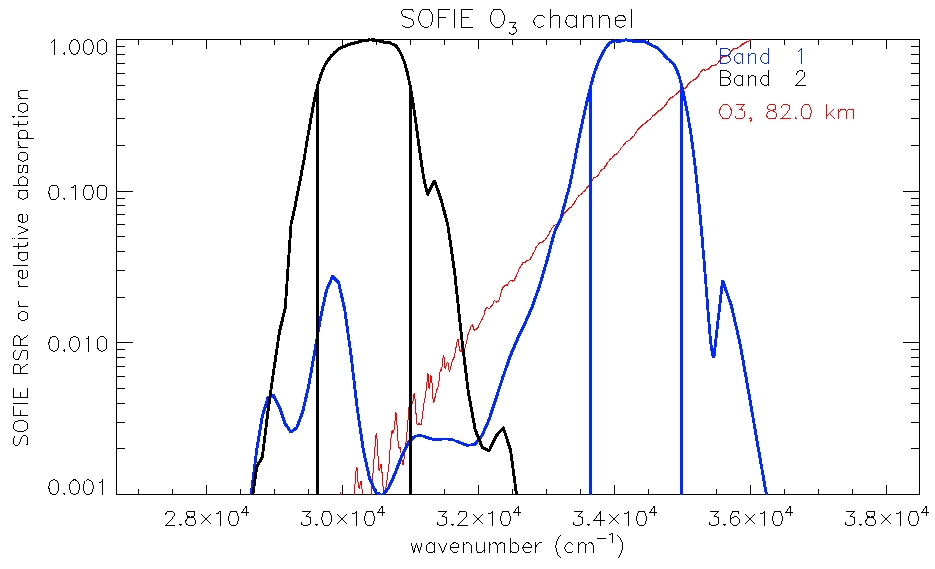
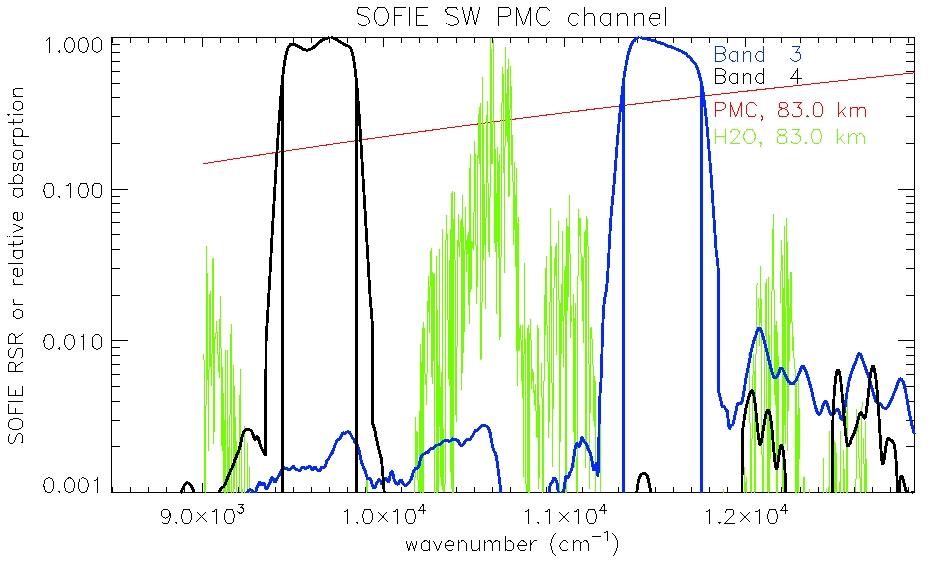
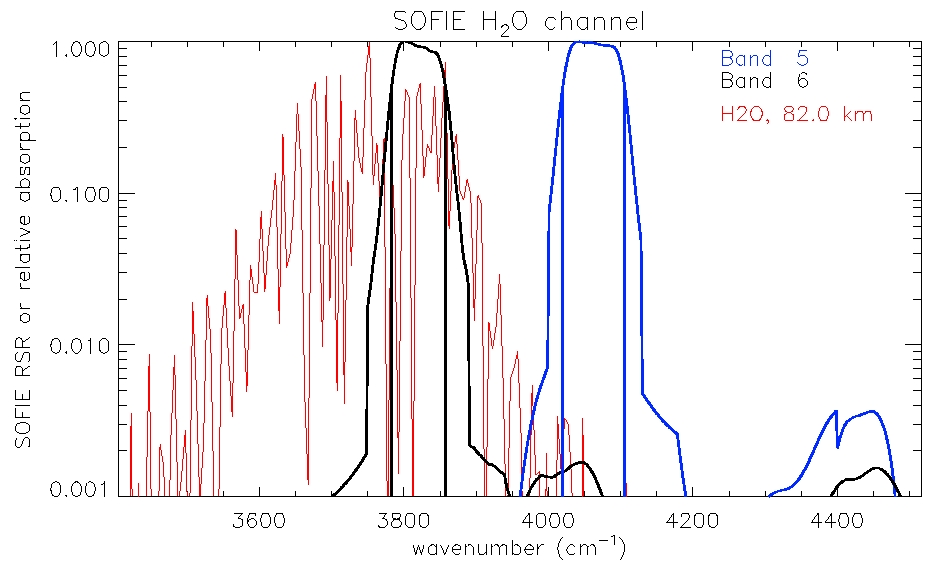
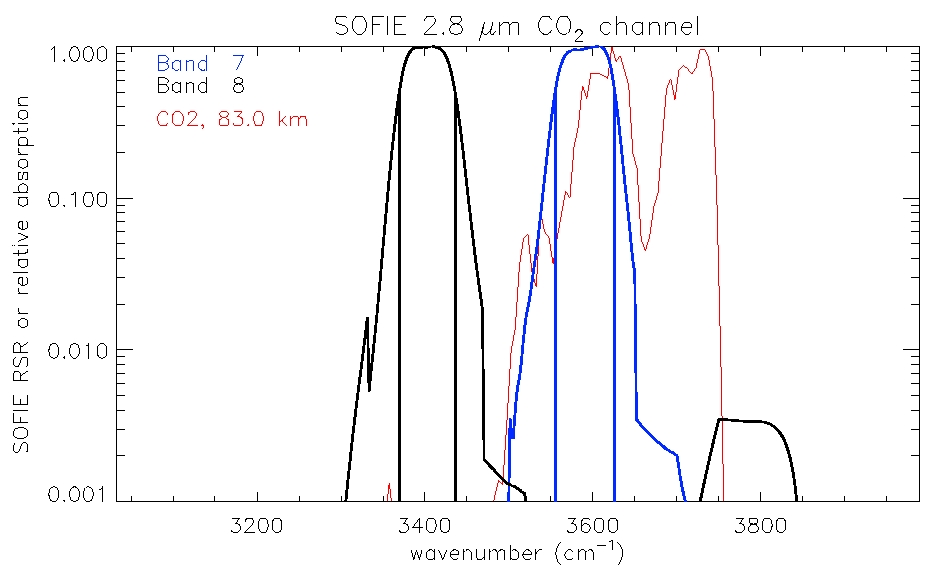
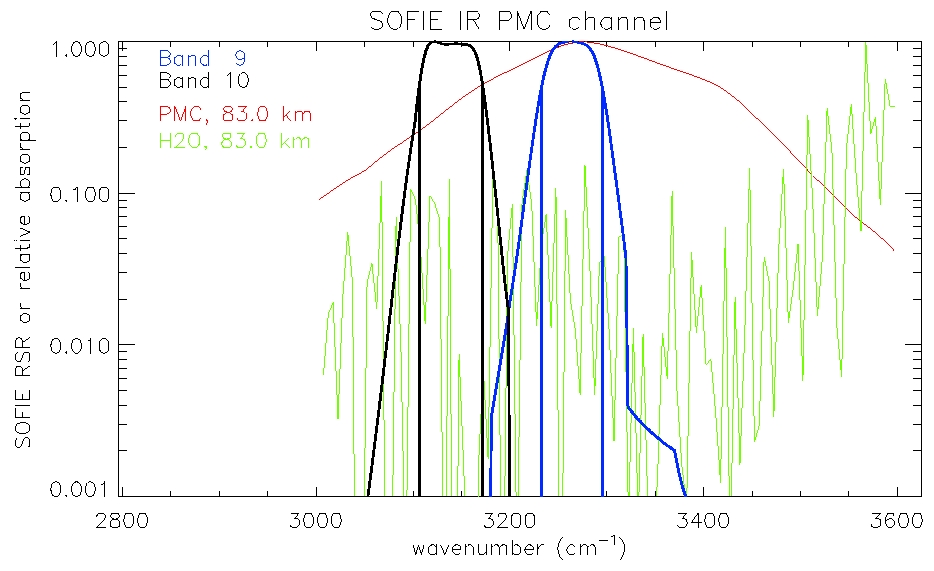
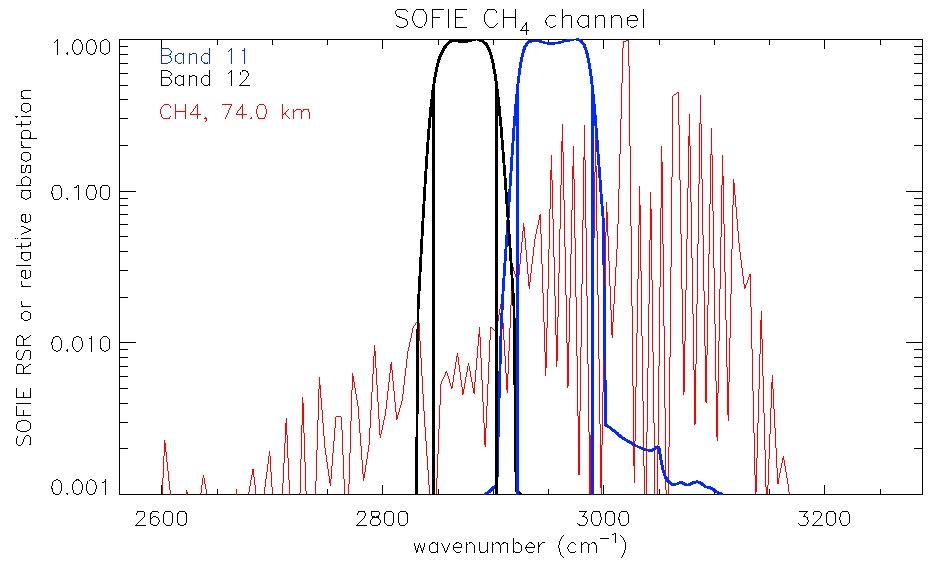
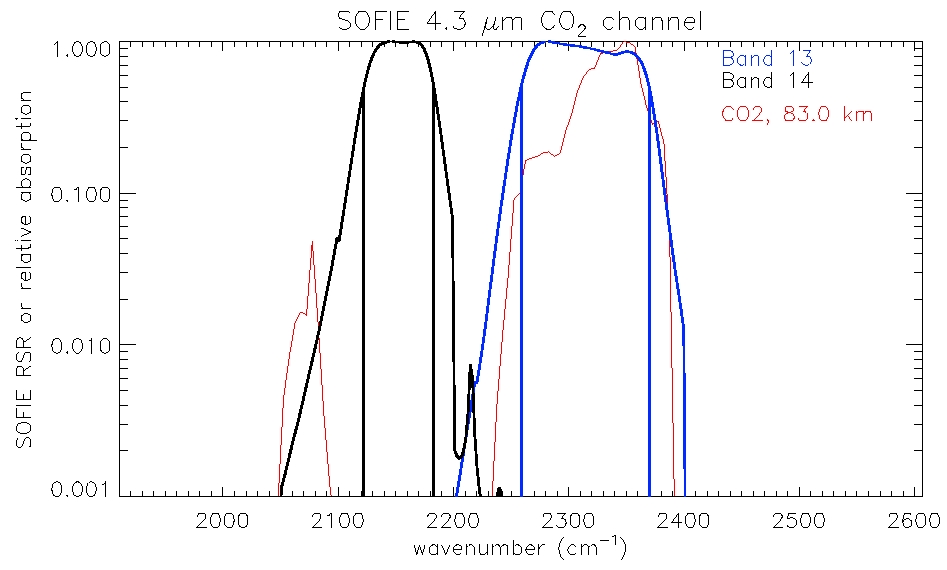
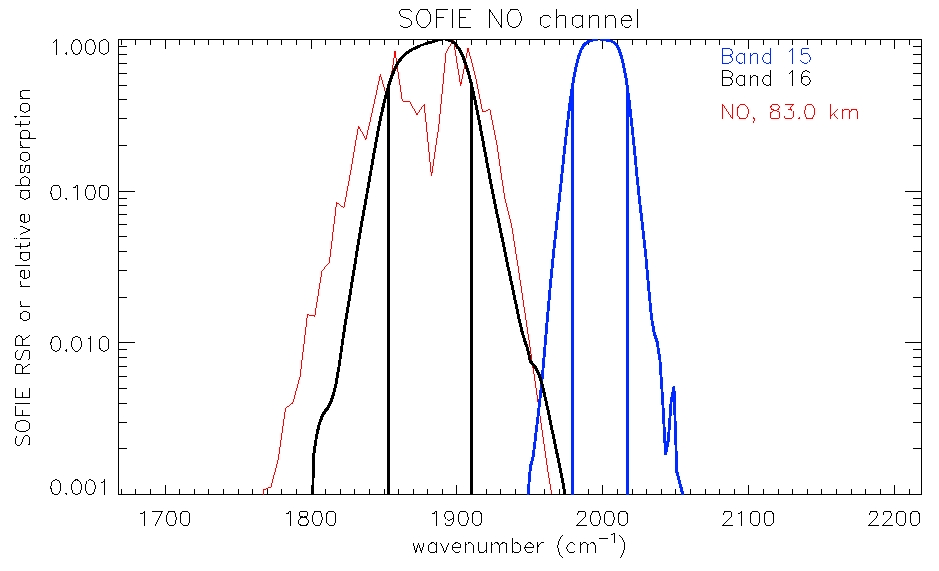
shown in Figure 2. Measured RSR plots and data are available
below. The plots show measured RSR and simulated atmospheric
absorption spectra. The data file header contains a format line
followed by the band number, number of points, beginning wavenumber
(1/cm), and wavenumber interval (1/cm). The RSR data are evenly
spaced with the first point corresponding to the beginning
wavennumber.
|
|
|
Calibration
Results from 24 June 2006, for nominal temperature :
1. O3 chan, plot data for band 1, 2 2. PMC chan, plot data for band 3, 4 3. H2O chan, plot data for band 5, 6 4. CO2 chan, plot data for band 7, 8 5. PMC chan, plot data for band 9, 10 6. CH4 chan, plot data for band 11, 12 7. CO2 chan, plot data for band 13, 14 8. NO chan, plot data for band 15, 16 |
Figure 1. Total response of the 16 SOFIE bands. The results are from calculations based on measured properties of flight components. The Planck function assuming the effective blackbody temperature of the sun is overlain (arbitrary units). |
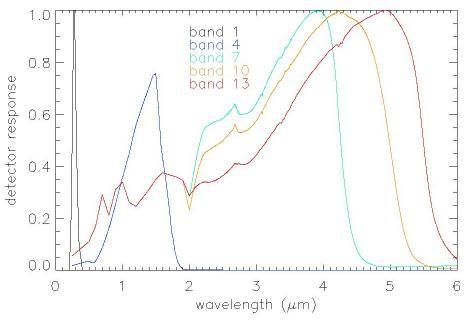 Figure
2. Spectral response of various SOFIE detectors from
measurements of flight components. A file of measured detector
spectral response curves is available here.
|
|
 |
|